Valuable for Current Valuations and Scenario Building
This gives the user the ability to see our "default" valuation based on our built in algorithm for forecasting. The default is very good at making reasonable assumptions in the absence of specific knowledge about a Company's plans and expectations. However our default may not be appropriate if a user has better knowledge of the Company's plans and expectations. A user can then input specific assumptions about CAPEX or Cash Flow expectations.
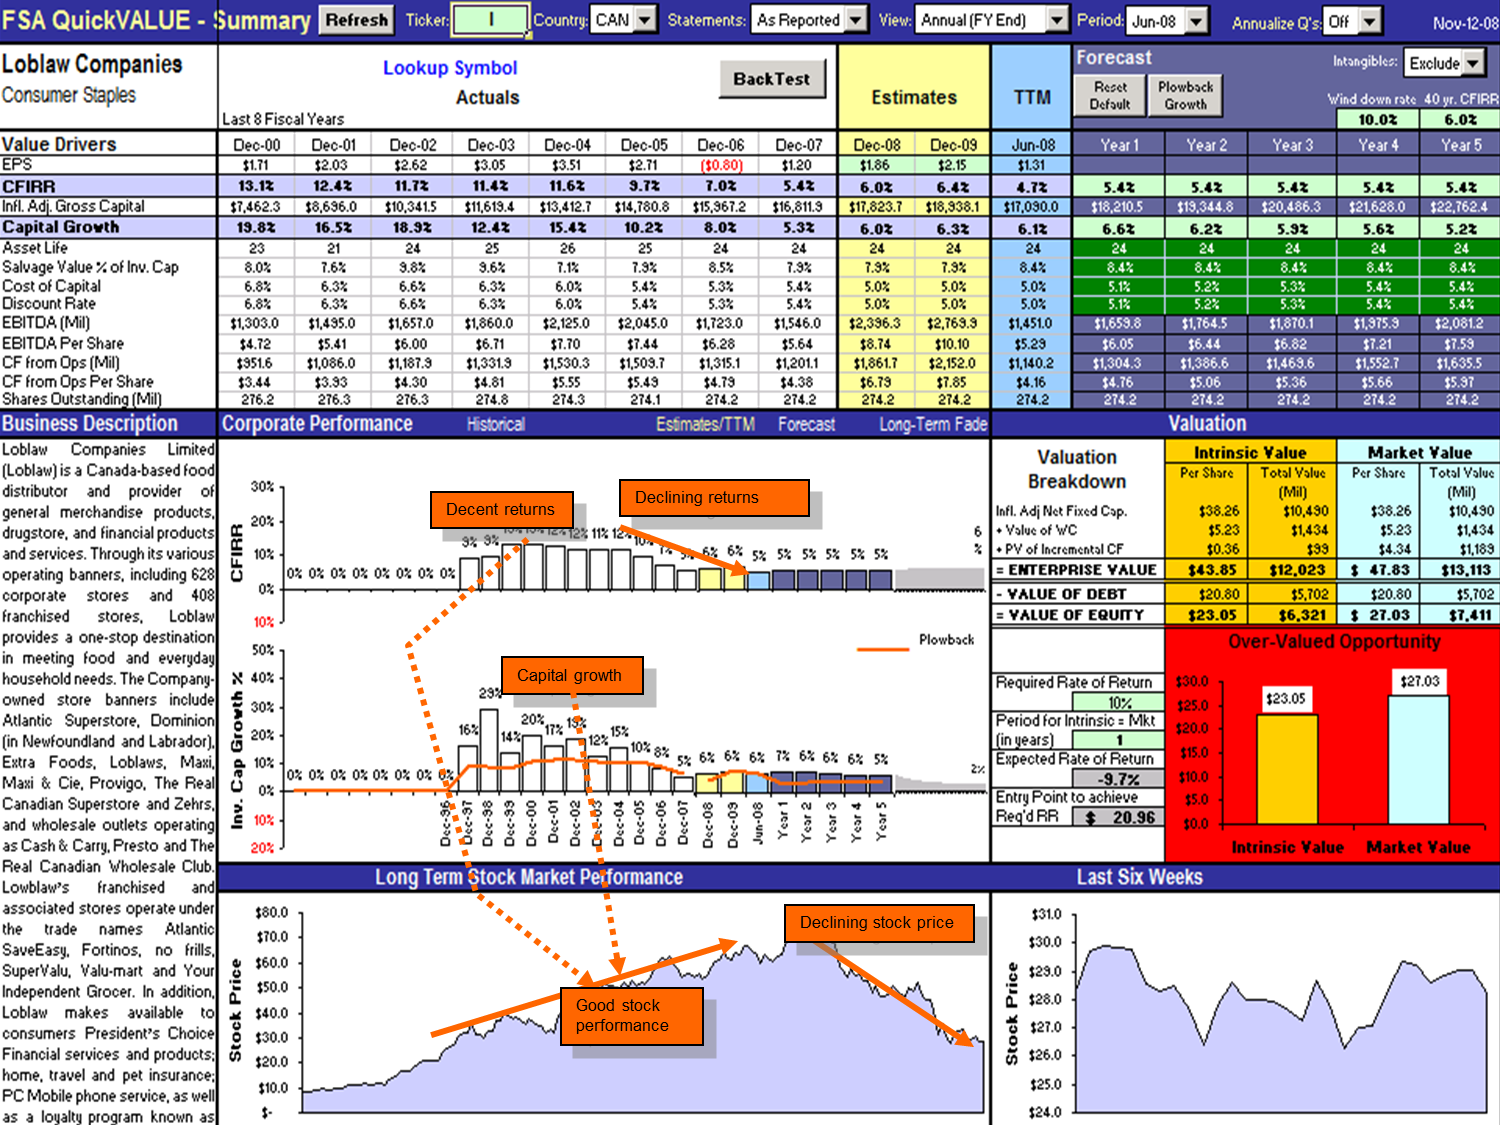
"Clear" Box Designed For Detailed Viewing
The product is designed to take a comprehensive and detailed look at one company at a time. Virtually every proprietary and traditional variable is calculated and available to review for trends level etc. It contains up to 20 years of annual financial statements, 60 quarters of quarterly financial statements and 20 years worth of stock prices. The model is neatly summarized on the "Summary" tab but detailed calculations and decision rules are available on 10 tabs sub-tabs. Despite all of our proprietary metrics and calculations FSA built a "clear" box to promote education and understanding of our methodology. We feel empowering the user and sharing our Intellectual Property is important for our success.
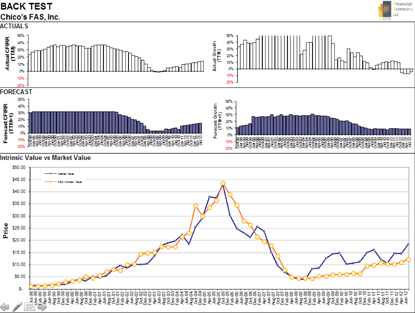
Includes Back-tests
One of the most powerful features of QuickVALUATION is the ability to back-test each company for "goodness of fit" over time. Our software can roll back the clock to any point in time to observe what our model was saying about the Company. What constitutes a good back-test still requires judgment. Does a small variance from the intrinsic vs. the actual market value constitute a good back-test? Or does a consistent intrinsic value compared to a highly variable actual market value constitute a good back-test? There are "default" back-tests and "customized" back-tests. A "default" back-test simply uses the built in algorithm for forecasting and calculating the value of the firm. The forecast for returns and capital growth bounces around with each passing quarter as the trend changes with every new piece of data. On the other hand, a "customized" back-test allows a user to input his own forecast. For instance, a user may wish to see how well the model works when a 12% return on capital and a 10% capital growth is used for every time period. Or a user may wish to change the default fade number to see if the market consistently pays up for long-term returns. The possibilities for customized back-tests are endless.
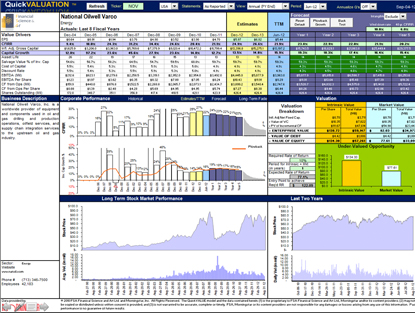
QuickFINANCIAL is used to evaluate any publicly traded Canadian or US stock in the non-financial sectors of the economy.
A user simply enters the stock ticker and the relevant countrythat the stock trades in, and in a few seconds QuickVALUATION makes financial projections of the company based on its financial history, and determines the stock's intrinsic value, using QuickVALUATION's proprietary CFIRR calculations.
Users can perform a wide variety of analysis, including:
View CFIRR Valuation Summary and compare to the Market Price
Perform Scenario Analysis
Conduct Back Tests
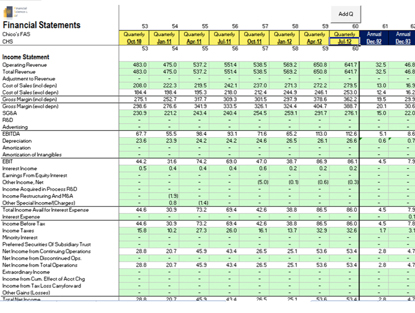
View Financial Statements
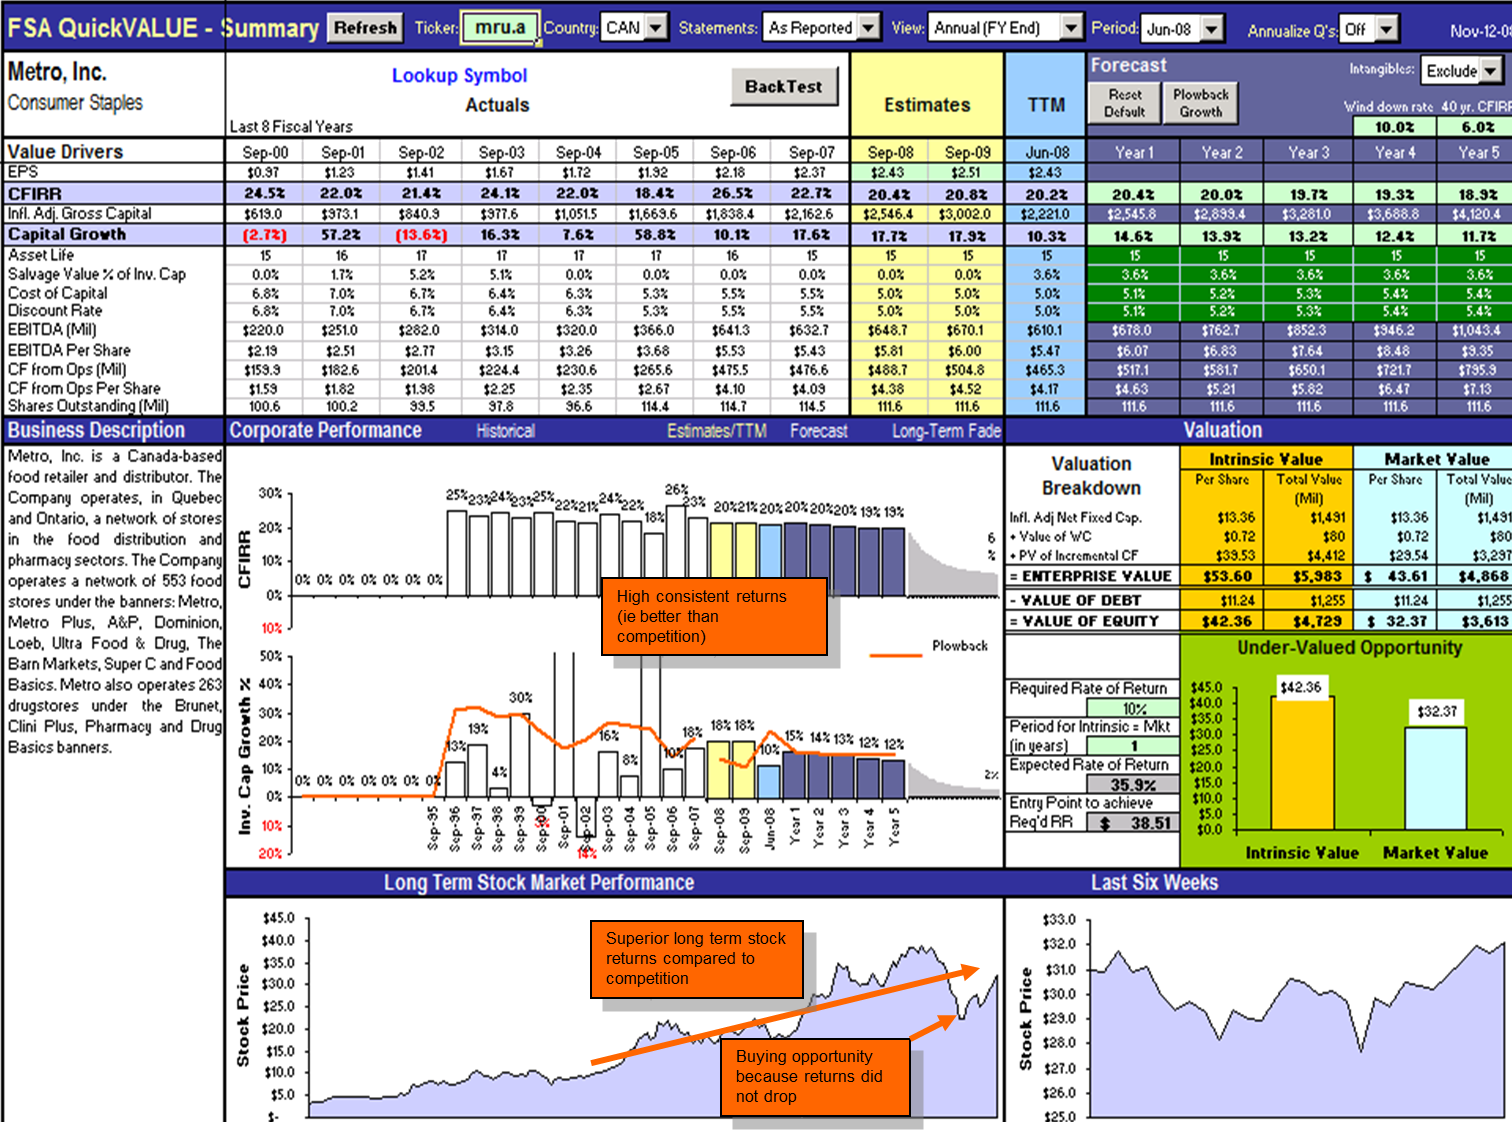
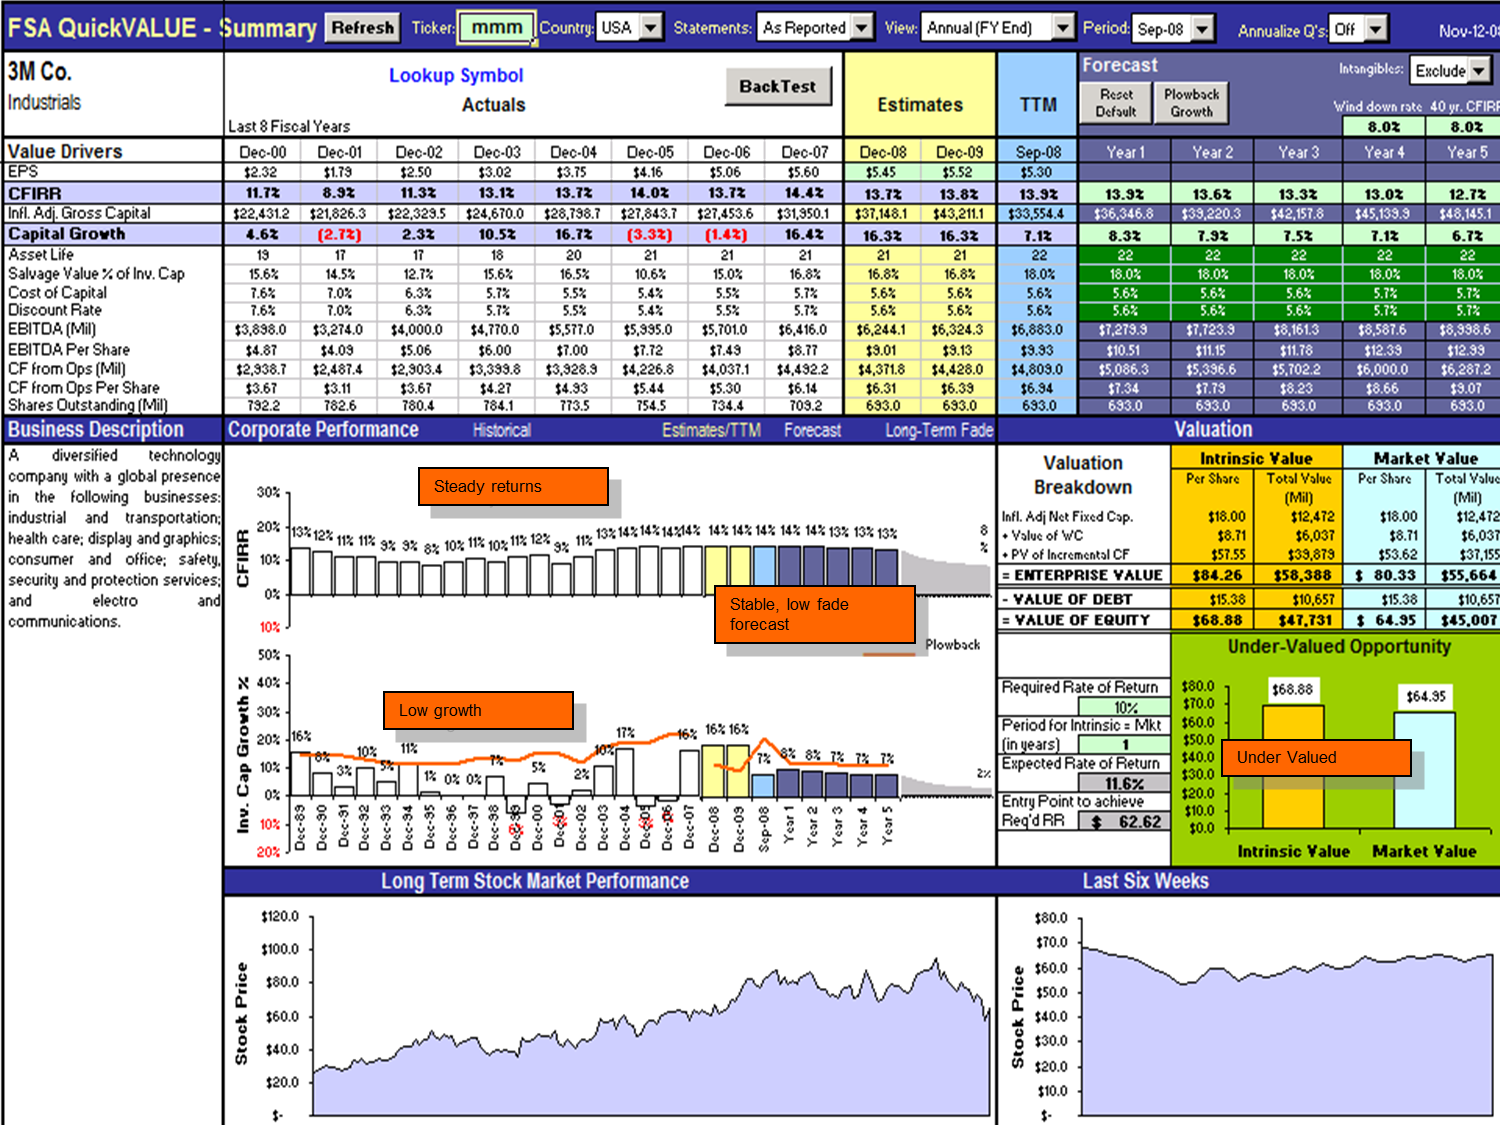
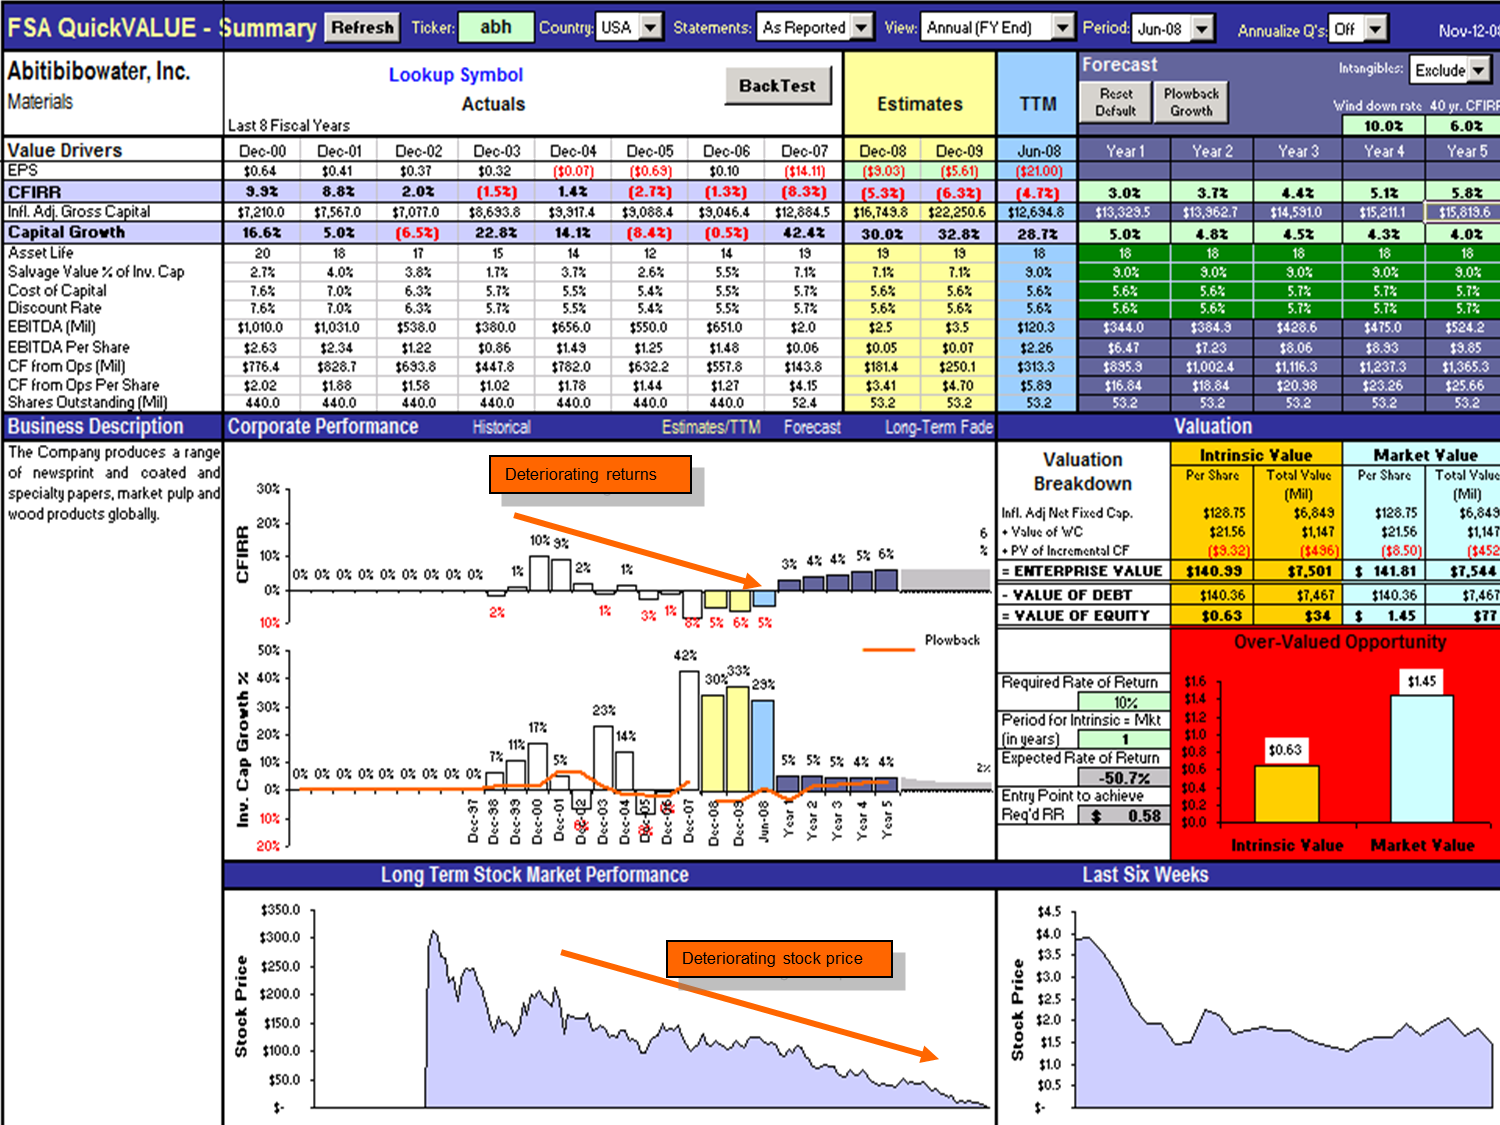
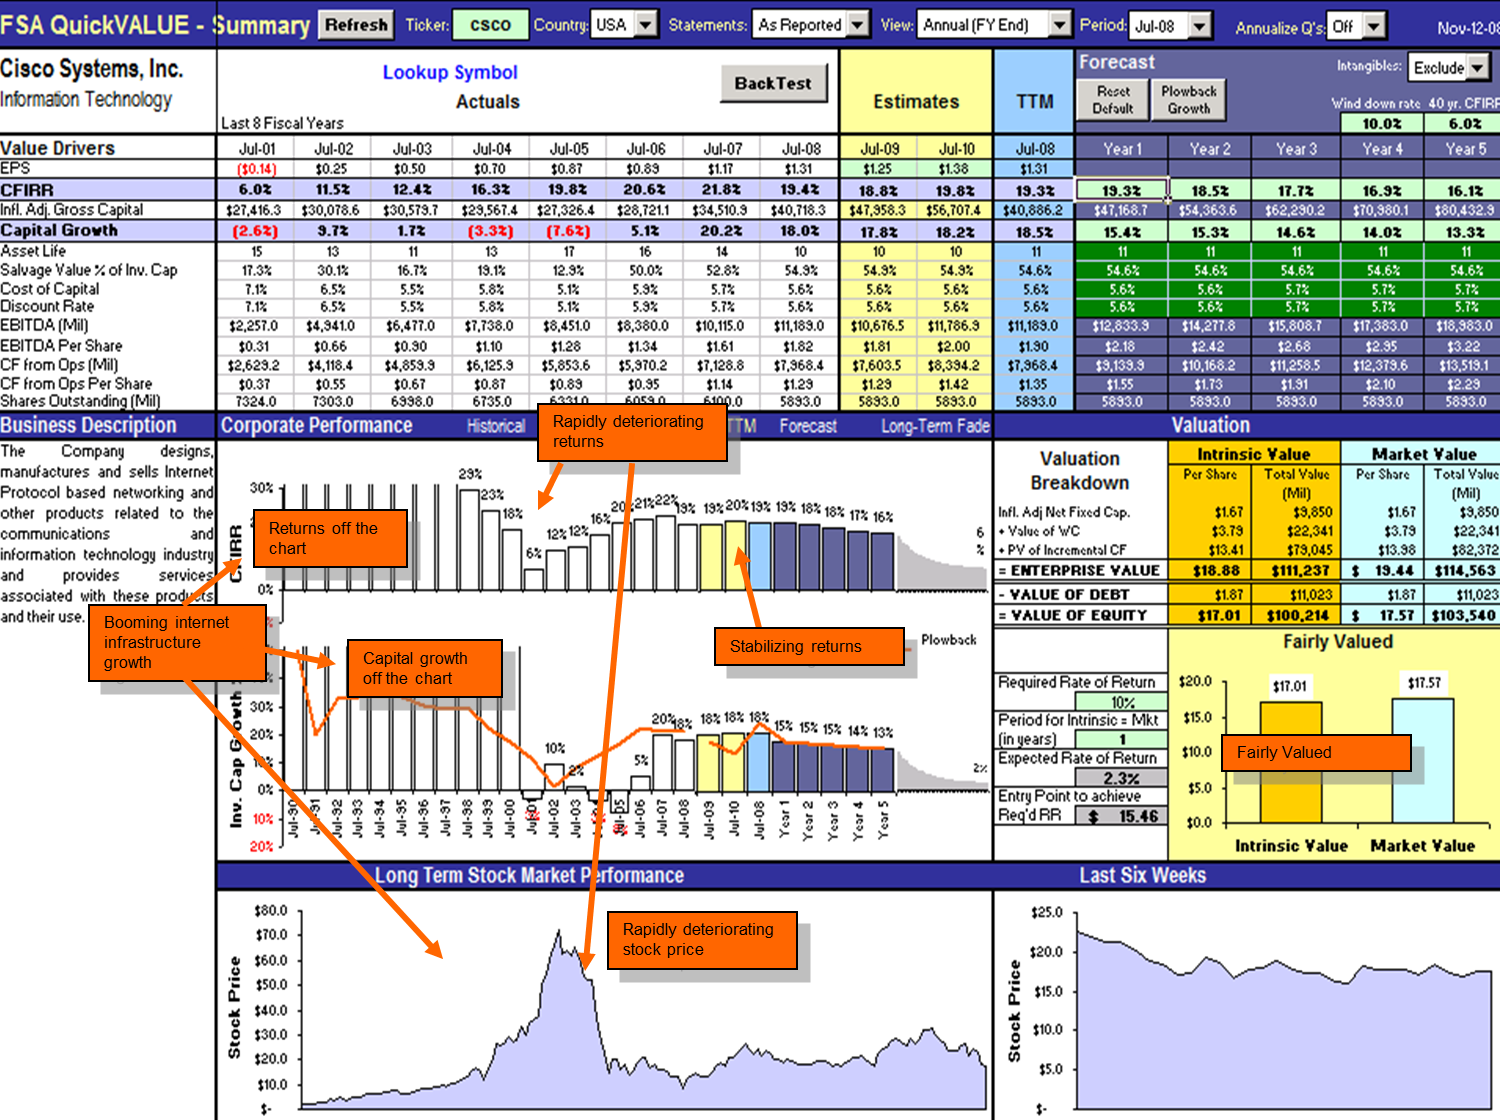
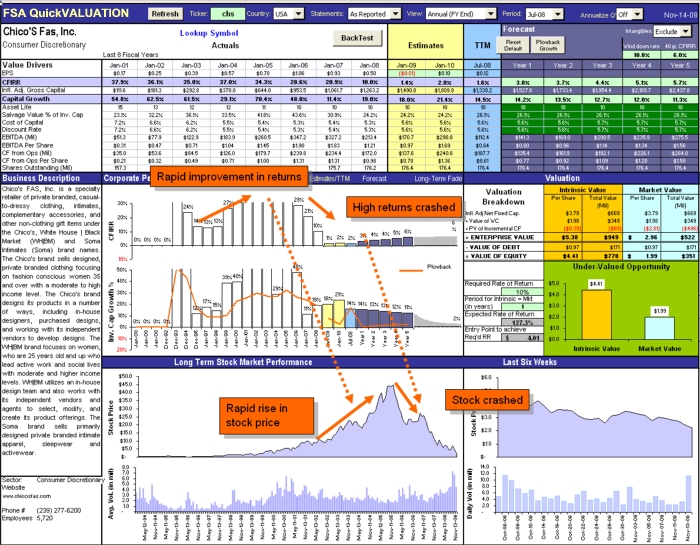
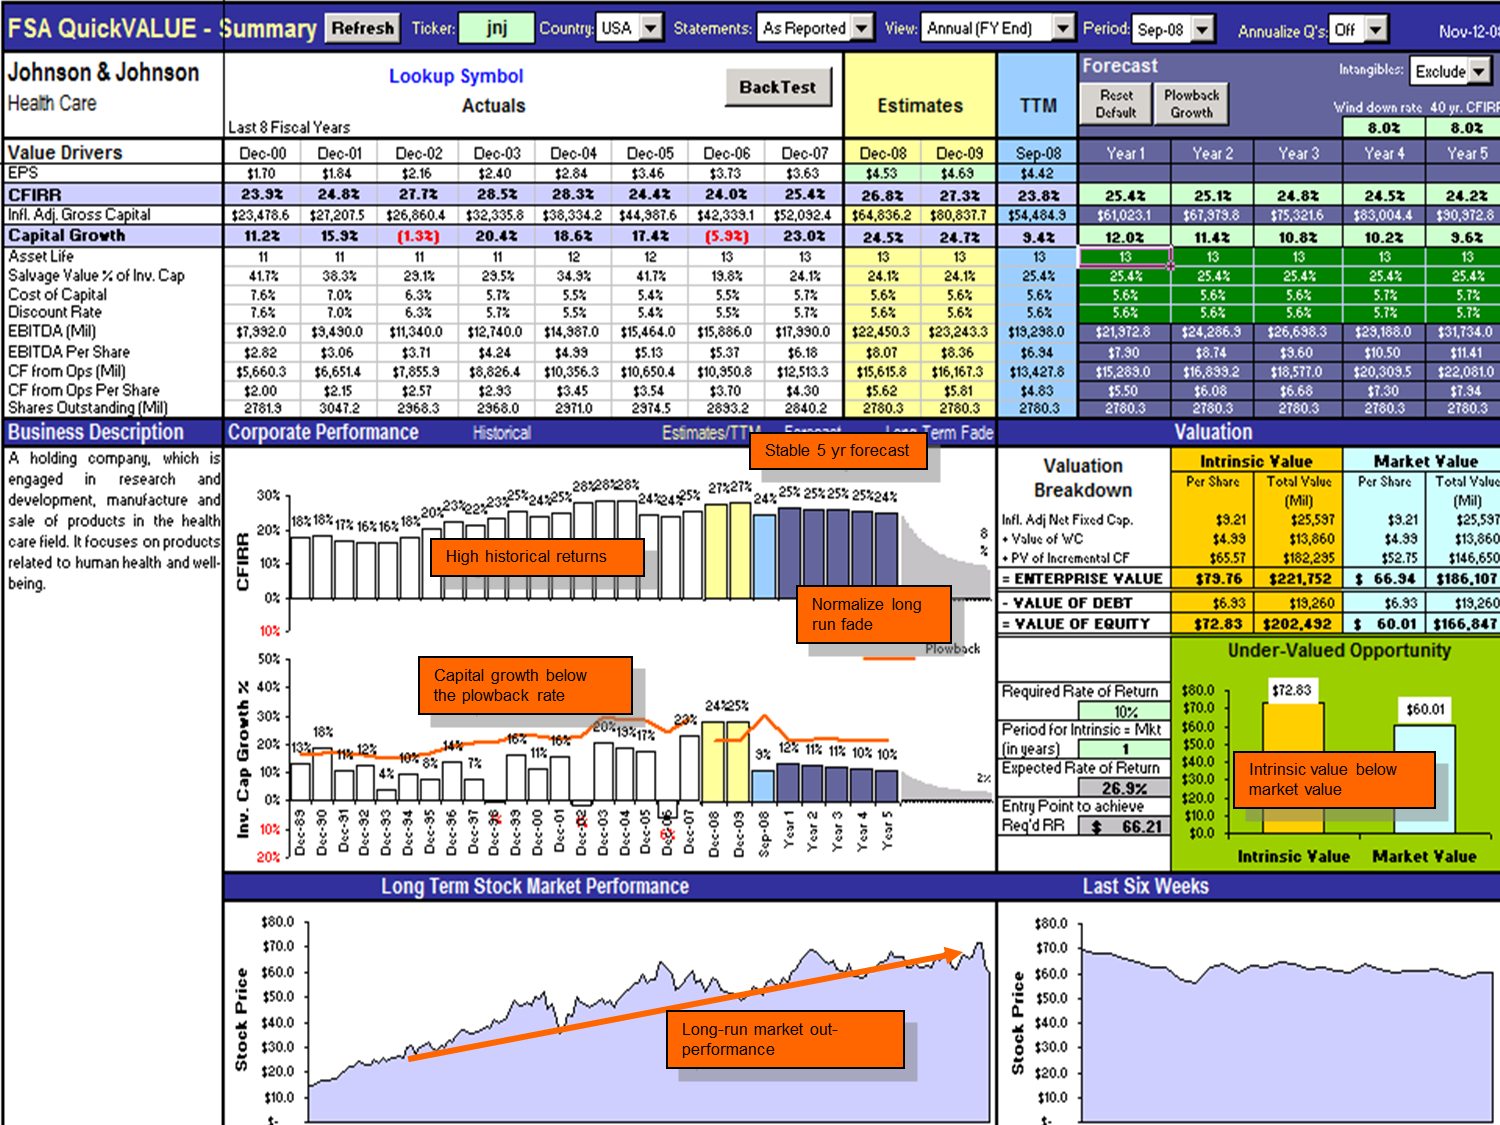
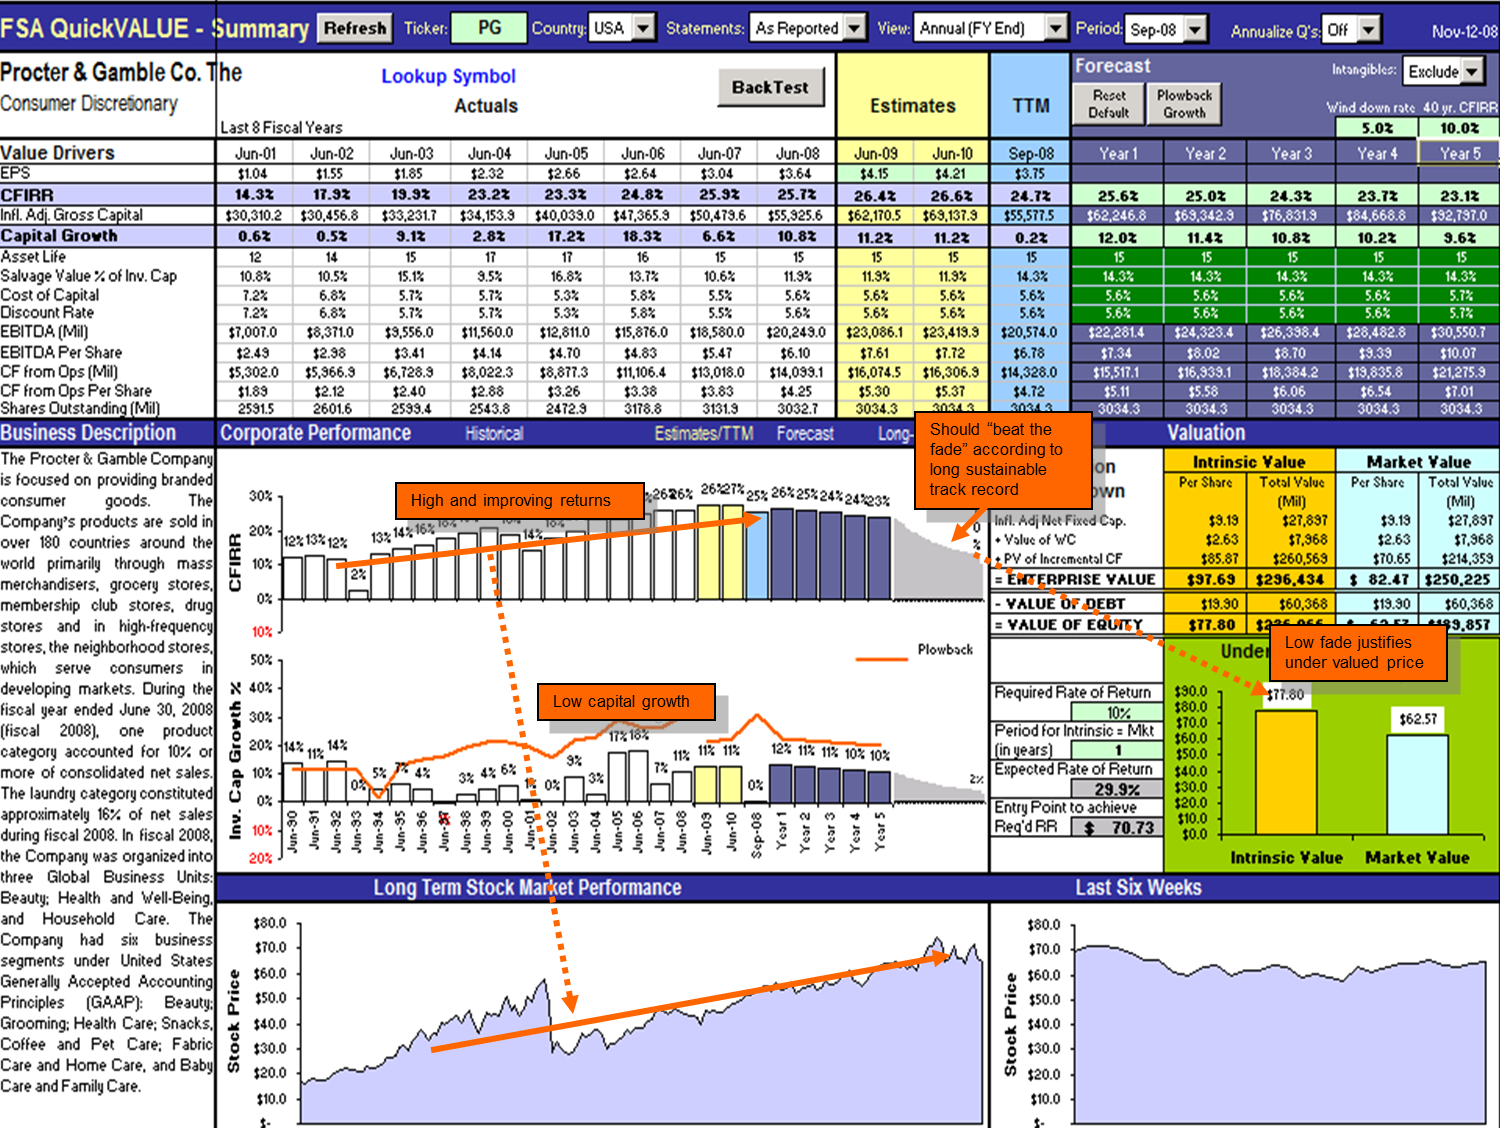
QuickVALUATION quickly pinpoints the strengths and weaknesses of a company's financial performance and helps to explain a stock's performance and price. We have provided some examples of companies we have analyzed using QuickVALUATION
| BIGGEST AND THE BEST | RISE AND FALL | RISE AND FALL, AND RISE AGAIN |
| Johnson & Johnson
Procter & Gamble Co. | Chico's FAS | Cisco Systems |
| COMPARING GROCERY CHAINS | STABLE | CHRONICALLY STRUGGLING |
| Loblaw vs. Metro | 3M Co. | Abitiibowater |
A user simply enters the stock ticker and the relevant country that the stock trades in, and in a few seconds QuickVALUATION makes financial projections of the company based on its financial history, and calculates the stock's intrinsic value.